
The Individual Giving Survey 2022 was commissioned by NICVA in December 2021 and distributed in January 2022.
Average amount donated per person in the last 12 months: £140.71
Introduction
The Individual Giving Survey 2022 was commissioned by NICVA in December 2021 and distributed in January 2022. Data collection was undertaken using a fully representative sample (n=1,013) of the Northern Ireland adult (16+) population in terms of age, sex, socio-economic grouping and area. This survey allows NICVA to gather data from members of the public in Northern Ireland to map their patterns of donating to charity. Changes in these patterns and methods of giving were also measured. You can find out more about the methodology here.
The findings from previous Individual Giving Surveys are presented below alongside findings from the new Individual Giving Survey 2022.
1.0 Charitable Giving in Northern Ireland
On average, £140.71 was donated to charity per person in Northern Ireland during the past 12 months.
- The Individual Charitable Giving Survey 2022 found that 64.5% of the adult population donated to charity over the last 12 months which marks a decrease of 2.5% from 2021
- During the past 12 months, on average respondents donated £140.71 to charity. This marked an increase in charitable giving on the figure reported in 2021 which was £135.78 per person
- The proportion of charity donations were on average significantly higher amongst males (£171.15) and those in the 65+ years (£220.68) age group
- Respondents married/living with a partner (£175.75) donated more to charity than those who were single/separated/widowed/divorced (£88.56)
Table 1: Donated to Charity in the last 12 months (n=1013)
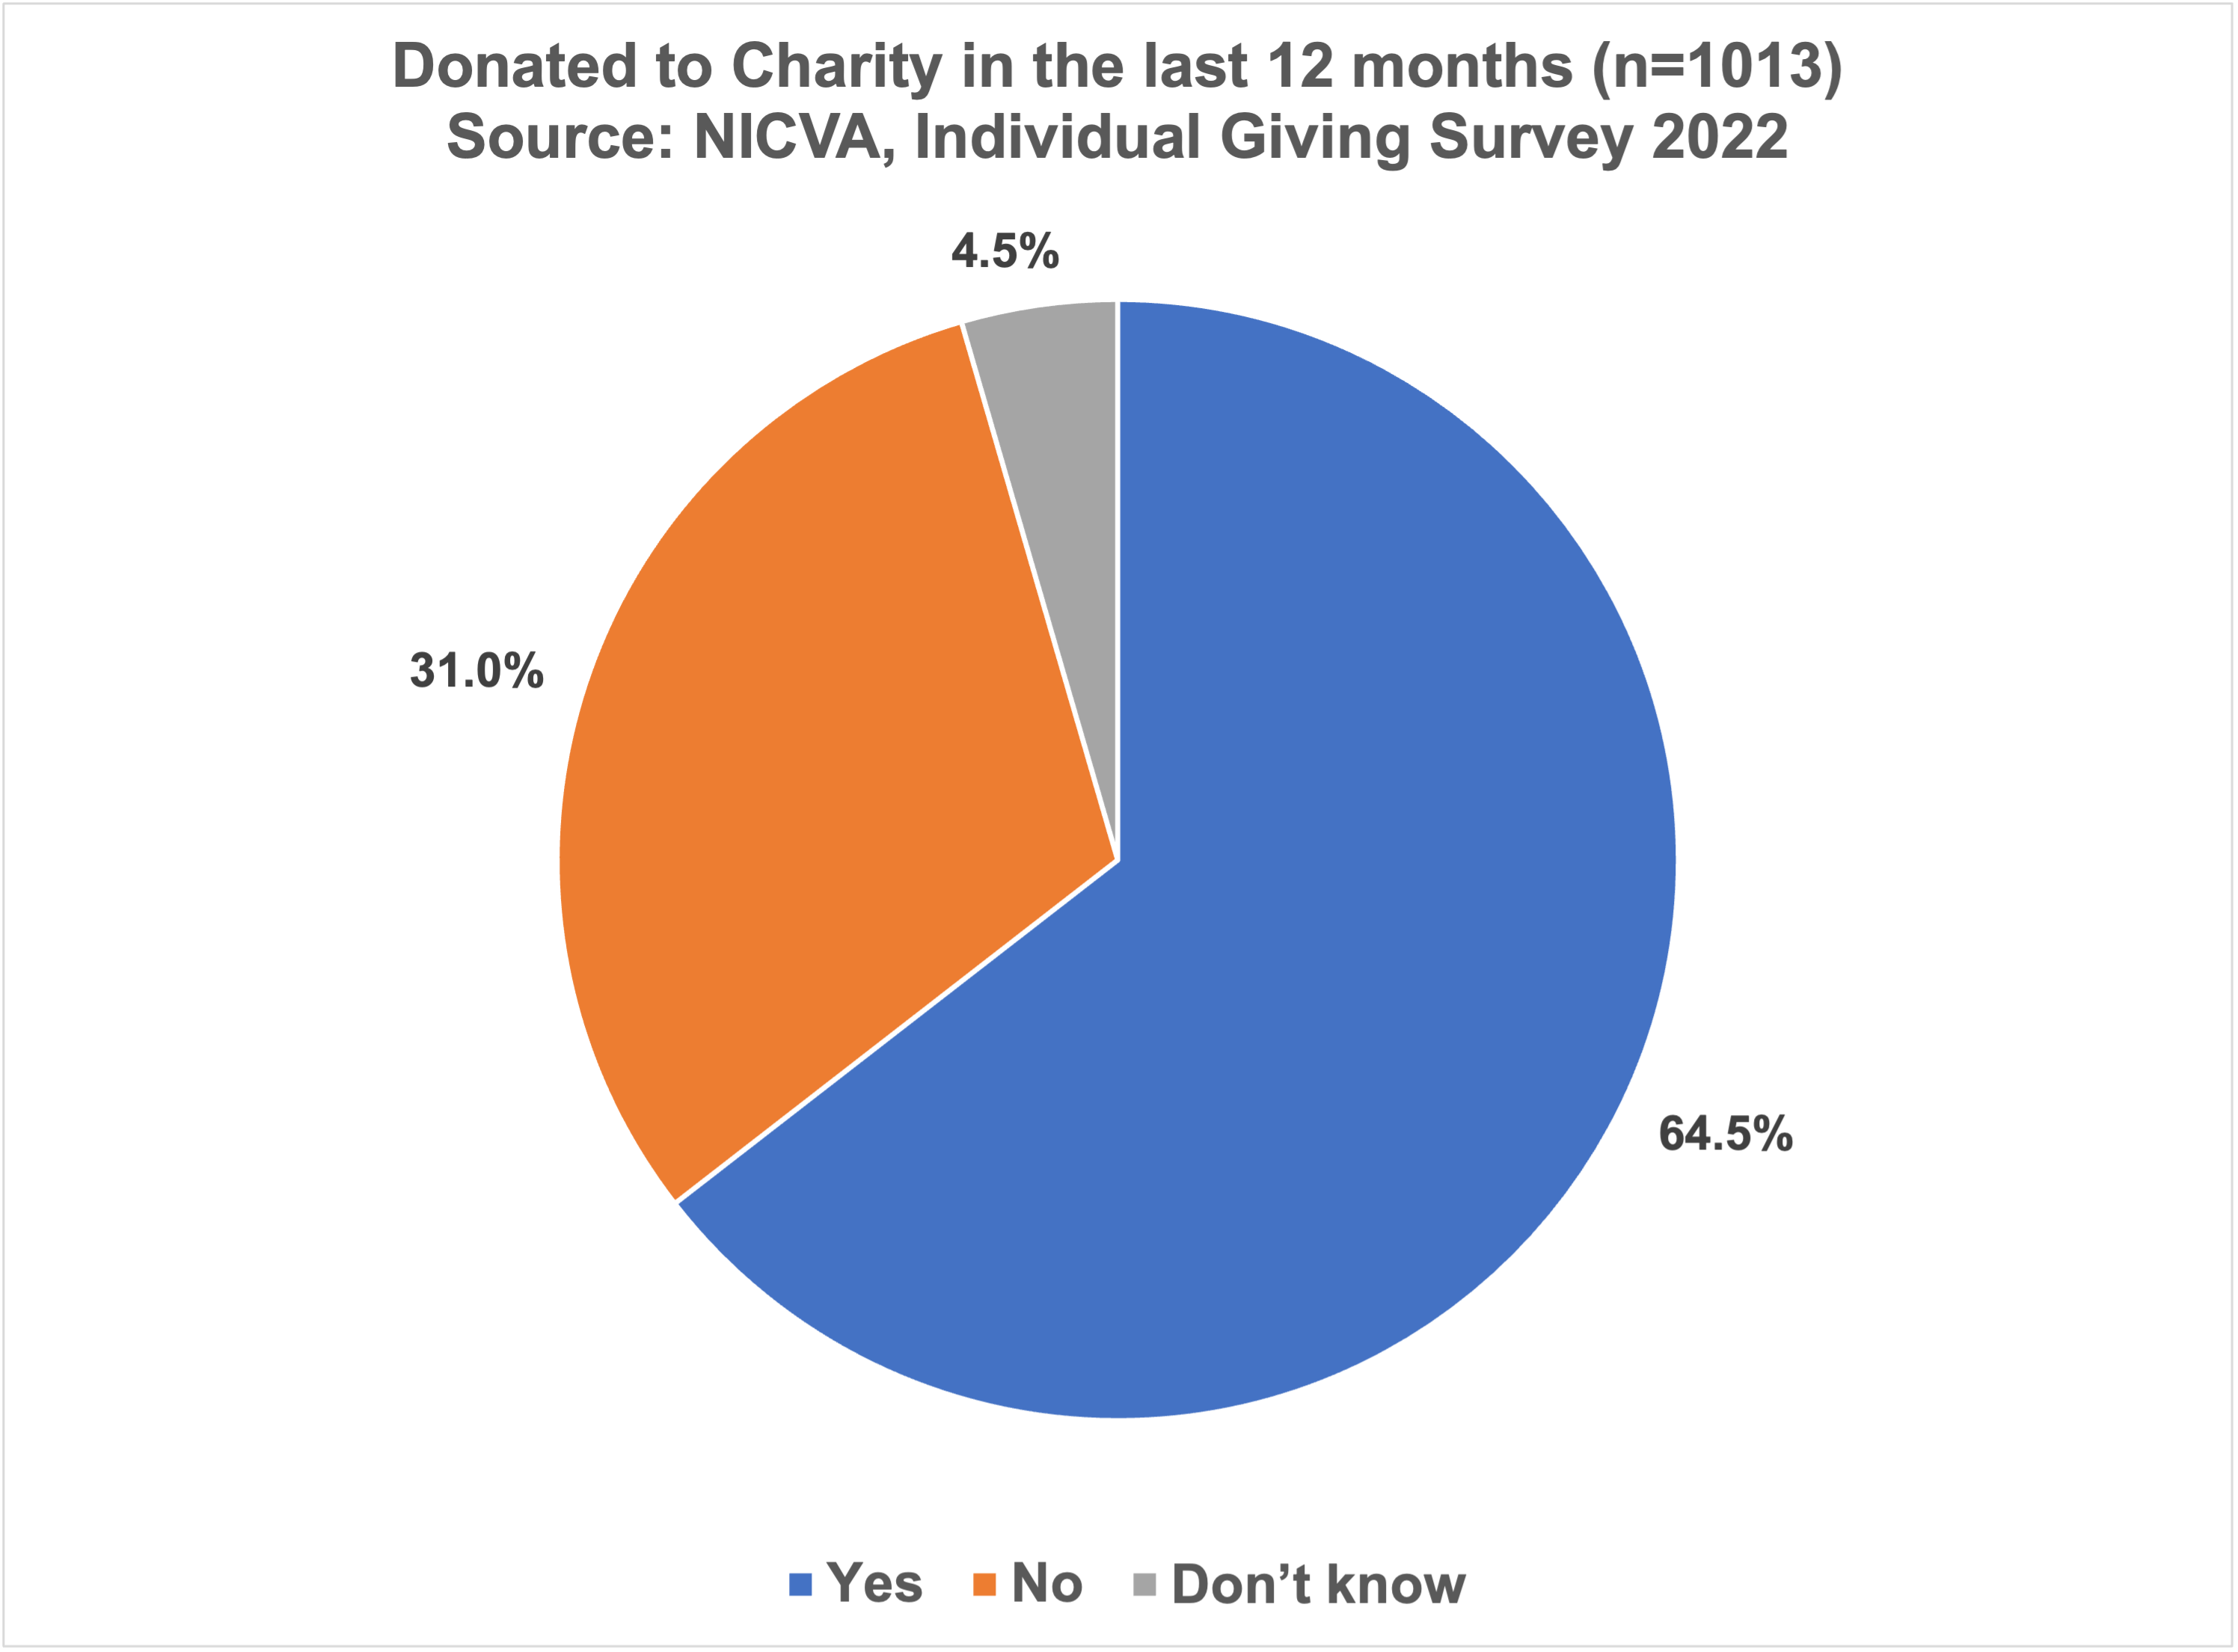
| Donated | Percent % |
|---|---|
| Yes | 64.5 |
| No | 31.0 |
| Don’t know | 4.5 |
2.0 Patterns of Charitable Giving
The Individual Giving Survey 2022 showed that respondents aged between 25-34 years (57%) were the least likely to have donated to charity in the past 12 months.
- Consistent with Individual Giving 2021, respondents aged between 25-34 years (57%) were the least likely to have donated to charity in the past 12 months whereas respondents aged 65+ (72%) were the most likely group to donate to charity
- Donor activity was more prevalent amongst respondents from more affluent ABC1 backgrounds (73%) and those living outside of the Greater Belfast area in the rest of NI (65%)
- In terms of donating to charity in the last 12 months, 49% of respondents reported that their charitable giving stayed the same, 23% had decreased their giving and 15% had increased their charitable giving
- Of those respondents who had decreased their charitable giving (23%), reasons cited included “job/income loss” (41%), “have not been asked to donate” (34%) and “have not been out as much/fewer opportunities to donate” (8%)
Table 2: Reasons for a decrease in giving in the last 12 months (n=212)
| Donated | Percent % |
|---|---|
| Job/income loss | 41 |
| Have not been asked to donate | 34 |
| Have not been out as much/fewer opportunities to donate | 8 |
| Prefer to support local business | 6 |
| Feel that charities are already well supported | 5 |
| Increase in cost of living | 5 |
| Other | 4 |
| Less cash available/using less cash/don’t use cash | 2 |
3.0 Intention to Donate to Charity
Almost half of respondents (45%) reported that they intend to donate money/gift to charity in the next 12 months.
- Almost half of respondents (45%) reported that they intend to donate money/gift to charity in the next 12 months. This is a small increase from the figure (46%) reported in Individual Giving 2021
- An almost equal proportion of males (44%) and females (46%) indicated their intention to donate or gift to charity in the next 12 months
- Respondents in the 65+ (53%) age group, those from affluent ABC1 backgrounds (55%) and those living in the Greater Belfast area (50%) were more likely to give to charity in the next 12 months
- Respondents indicated that a “change in personal situation to have more disposable income” (52%), “charity campaigns highlighting impact and/or need” (23%) and a “change in job status/situation (22%) would allow them to increase their donations in the next 12 months
| Intention to donate | Percent % |
|---|---|
| Yes | 45 |
| No | 33 |
| Don’t know | 22 |
- Over half of respondents (53%) felt that they would be more likely to donate to a charity if the charity had supported them or their family/friends. Females (61%) were more likely to donate for this reason compared with males (45%)
- A similar percentage of respondents (48%) would be more likely to donate if the charity was local to them. Males (50%) and those aged 18-24 years (55%) were more likely to donate for this reason
- 40% of respondents felt that they would be more likely to donate if the charity had a Northern Ireland focus. Females (42%) were more likely to donate for this reason compared with males (38%) and those aged 50-64 years (44%) and 65+ years (44%)
- Over a third (34%) would be more likely to donate if someone they know asked them to donate
| Reasons | Percent % |
|---|---|
| The charity had supported you/family/friends | 53 |
| The charity was local to you | 48 |
| The charity had a Northern Ireland focus | 40 |
| Someone you know asked you to donate | 34 |
| The charity was registered with the Charity Commission for Northern Ireland | 20 |
| The charity displayed the Fundraising Regulator badge | 12 |
4.0 Methods of Giving
4.1 Methods of Donating to Charity
Cash (61%) was the most popular method of donating to charity.
- Cash remains the most popular method of donating to charity, with the Individual Giving Survey 2022 revealing that 61% of donors used this method
- Respondents aged 65+ years (68%) and those aged 50-64 years (63%) were more likely to donate cash to charity
- Over a third of the respondents (39%) also donated to charity shops, predominately more popular 65+ years age group (53%)
- A small proportion (4%) indicated that they donated to charity through payroll giving (4%). This type of donation was more prevalent in males (4%) than females (3%) and in those aged 25-34 years (6%)
- Finally, 8% of respondents indicated that they never donate to charity
| Method | Percent % |
|---|---|
| Cash | 61 |
| Donate to charity shops | 39 |
| Sponsor friends and family | 24 |
| Purchase a product or service from charity | 22 |
| Direct debit | 19 |
| Directly through website/social media | 19 |
| Raffles | 18 |
| Attend an event | 10 |
| Competitions | 8 |
| I never donate to charity | 8 |
| Purchase through online shop | 7 |
| Payroll giving | 4 |
| Other | 3 |
4.2 Methods of Digital Donations
The most popular digital method used by respondents to donate to charity was PayPal (45%)
- Of those who donated digitally, almost half (45%) of respondents donated to charity using PayPal. This marks an increase in the number of respondents who donated via PayPal (37%) in the previous survey. PayPal donations were highest amongst females (51%) and those in the 18-24 years (55%) and the 25-34 years age group (48%)
- Online giving platforms (34%) e.g., JustGiving, GoFundMe were the second most utilised method of donating digitally. This shows a slight increase from the figure cited in the Individual Giving Survey 2021 whereby 32% of respondents used this method
- Donating via direct debit (32%) was the third most used method, marking a decrease from the figure (43%) reported in the 2021 survey. Males (39%) were more likely to use this method compared with females (26%) and those aged 65+ years (43%)
- It was reported that 19% of respondents donated directly through a charities website which marked a decrease from the previous survey (27%)
- Apps (4%) were one of the least preferred methods used to donate digitally to charity
| Method | Percent % |
|---|---|
| PayPal | 45 |
| Online Giving Platform e.g., JustGiving, GoFundMe | 34 |
| Direct Debit | 32 |
| Directly through charity website | 19 |
| Text | 16 |
| Social media/event | 15 |
| Online shopping | 8 |
| Contactless ("tap and pay) terminal | 6 |
| App | 4 |
| Other | 1 |
4.3 Reasons for Not Donating Digitally
Almost two thirds (62%) of those who did not donate using digital means cited that the main barrier was that it was “easier to give cash when asked”
- Of those who did not donate via digital means barriers cited included that it was easier to give cash when asked (62%), cyber security concerns (34%) and a lack of understanding of how it works (9%)
- 7% of respondents cited that they did not carry/use a card and 3% cited a lack of contactless (“tap and pay”) terminals
| Reason | Percent % |
|---|---|
| Easier to give cash when asked | 62 |
| Cyber security concerns | 34 |
| Lack of understanding of how it works | 9 |
| Do not carry/use a card | 7 |
| Other | 6 |
| Lack of contactless (“tap and pay”) terminals | 3 |