
This Future Issues chapter includes the following research:
As part of NICVA's State of the Sector research portfolio, each year several viewfinder surveys are undertaken to provide a snapshot of current issues that may potentially impact our member organisations and those they represent. In 2020, a series of seven surveys were issued to help us understand the impact of Covid-19 on VCSE sector organisations in NI and the future implications of the pandemic for their work. Below are the key findings from two of NICVA’s most recent surveys undertaken in August 2020 and November 2020. Further details of the results of the five preceding 2020 surveys can also be found here.
The Covid-19 Impact Survey August 2020 (n=200) and the Covid-19 Impact Survey November 2020 (n=220) were disseminated to all heads of VCSE sector member organisations in Northern Ireland. This report contains data from both surveys, and comparisons will be made where appropriate. This data represents a sample of the NICVA membership and is not necessarily fully representative of all VCSE sector organisations in Northern Ireland.
Impact of Covid- 19 on VCSE Sector Organisations
| Value | Percent | Count |
|---|---|---|
| Services/Activities have been stopped | 66.2% | 143 |
| Funding/Income has been lost | 68.1% | 147 |
| Staff have been made redundant | 11.6% | 25 |
| Staff have been furloughed | 38.4% | 83 |
| Volunteers have been unavailable to volunteer | 60.2% | 130 |
| Other | 23.1% | 50 |
- Approximately 68% of organisations indicated that they had lost funding/income due to the Covid-19 pandemic. This showed a small increase from the figure (67%) reported in the August survey
- In August, 73% of organisations reported that their services/activities had been stopped, however this decreased slightly to 66% in November
- It was also reported that approximately 60% of volunteers were unable to volunteer in organisations, a similar figure was reported in the August survey
- Both surveys indicated that over 38% of staff in organisations had been furloughed
- There was a notable increase in the number of staff who had been made redundant which more than doubled from August (5.6%) to November (11.6%)
- Additional impacts on organisations were cited including an increased workload, staff under extreme stress, issues with access to software and hardware, services restructured and inability to fundraise
- In November, almost 33% of organisations reported that 100+ beneficiaries were impacted per week
- In November, 40% of organisations indicated that between 76-100% of their volunteers had been unable to volunteer. This marks a 10% increase from the figure (50%) cited in the August survey
| Value | Percent | Count |
|---|---|---|
| 0-25% | 39.2% | 56 |
| 26-50% | 26.6% | 38 |
| 51-75% | 18.2% | 26 |
| 76-100% | 16.1% | 23 |
| Total | 100% | 143 |
- In November 2020, over 39% of organisations reported that they lost between 0-25% of their funding/income with a further 16% loosing between 76-100%
- These figures had slightly decreased from those reported in the August survey with almost 47% loosing between 0-25% and over 18% loosing 76-100% of their funding/ income
- In August, organisations reported that the top three most pressing issues facing their organisation in order were “sustaining our organisation and activities”, “finance/cash flow” and “changing our services to meet emerging needs”
- Additional issues faced included difficulty planning for the future, problems managing increasing demands on the organisation, fundraising issues, staff and volunteer’s wellbeing and lack of clarity on mandatory procedures
Adaptation of Services and Activities
- In November, only 29.5% organisations were delivering 76-100% of their normal services and/or activities and almost 25% of organisations were delivering 1-25% of their services
- Many organisations were forced to develop new services as a result of the pandemic. 42.3% of organisations indicated that between 1-25% of their current services were new and developed in response to Covid-19. Almost 5% of organisations reported that between 76-100% of their current services were also new and developed in response to Covid-19
| Value | Percent | Count |
|---|---|---|
| None | 22.2% | 43 |
| 1-25% | 42.3% | 82 |
| 26-50% | 21.6% | 42 |
| 51-75% | 9.3% | 18 |
| 76-100% | 4.6% | 9 |
| Total | 100% | 194 |
- Example of new services developed included prescription collection, food parcel sourcing and delivery, community counselling services, Covid-19 community support programmes, mental health and money advices services and befriending and support services for the elderly
- Organisations also provided financial support to those in need, summer schemes for children, community gardens, community meals, antenatal and parenting support delivery via WhatsApp, educational packs for children, transport provision when necessary and voucher schemes for fuel
Expectations for the Future
| Value | Percent | Count |
|---|---|---|
| Extremely Critical- The organisation will not survive | 1.4% | 3 |
| Critical- The organisation may not survive | 9.9% | 21 |
| Very Difficult- Our income, staff/volunteers, or service users/beneficiaries are likely to fall by 50% or more | 29.1% | 62 |
| Difficult- Our income, staff/volunteer numbers, or service users/beneficiaries are likely to fall by 25% or more | 23.9% | 51 |
| Manageable- Neither our income, staff/volunteer numbers, services users/beneficiaries are likely to fall by more than 25% | 35.7% | 76 |
- As evidenced above, almost 36% of organisations reported that the financial position would be manageable where neither their income, staff/volunteer numbers, services users/beneficiaries would likely to fall by more than 25%
- Almost 30% indicated that the financial position of their organisation would be very difficult where their income, staff/volunteers, or service users/beneficiaries would likely to fall by 50% or more
- A small number of organisations (1.4%) stated that their financial position was extremely critical and that their organisation would not survive in the next 3-6 months
- In response to the Covid-19 pandemic, many organisations developed new methods of service/delivery which they expect to continue to deliver post Covid-19. Such new services include online baby yoga and reflexology, online/offline training delivery and meeting attendance, working from home, smaller onsite group settings, garden gate visits to combat isolation and online parenting programmes
| Value | Percent | Count |
|---|---|---|
| have reduced by up to 25% | 26.9% | 50 |
| have reduced by 26-75% | 26.9% | 50 |
| have reduced by over 75% | 6.5% | 12 |
| be the same as now | 23.7% | 44 |
| have increased by up to 25% | 10.8% | 20 |
| have increased by 26-75% | 3.8% | 7 |
| have increased by over 75% | 1.6% | 3 |
- Almost 27% or organisations expected the capacity of their organisations to have reduced by up to 25% with a further 27% expecting a reduction by 26-75%
- Almost 24% expect their organisations capacity to remain the same as now
- A small percentage (1.6%) of organisations expect that there will be an increase by over 75% in their capacity to deliver services and activities in the next 12 months
- Despite the challenges of the Covid-19 pandemic on organisations, almost 44% of organisations felt quite optimistic about the future of their organisation, 28.9% felt neutral about their future. However, 18.7% were quite pessimistic about their future of their organisation
Capacity Building, Skills Development and Future Innovation Needs of Organisations
- In August, organisations indicated the top five most pressing capacity building and skills development needs to adapt to the current and future post Covid-19 situation. The top five needs listed in order were “safe working in the office and outside”, “digital skills (e.g., use of videoconferencing for meetings and events)”, “risk management”, “financial planning” and “post Covid-19 fundraising”
- Additional needs were cited and included psychological and mental health support for staff and volunteers, digital upskilling and access to digital systems, fundraising training, marketing and communications, strategy planning, more volunteers, Covid-19 risk policies and partnership working
- Organisations indicated future innovations that they believed should be developed to adapt to and meet the needs of society in a post Covid-19 environment. Suggestions included support/funding to manage the safety of people indoors and outdoors as per Covid-19 regulations, webinar training, free access to broadband for all, securing long term rather than short term funding and representation at the recovery and renewal discussions. Others suggested redirecting overhead savings back into frontline services, free mental health/counselling services for employees and affordable community based cleaning for organisations with no budget
Cashless Giving Survey 2019
As part of NICVA's State of the Sector research portfolio, each year a number of viewfinder surveys are undertaken to provide a snapshot of current issues that may potentially impact our member organisations and those they represent. In 2019, viewfinder surveys were issued on the topics of Cashless Giving and on awareness and use by the sector of the UN Sustainable Development Goals (SDGs). Key findings from both surveys are reported below.
This survey was disseminated to all NICVA members in October 2019. A total of n=102 participants responded to the survey. This data represents a sample of the NICVA membership and is not necessarily fully representative of all VCSE sector organisations in Northern Ireland.
1.0 Cashless Giving and Fundraising
- Almost 40% of organisations had reported that they had incorporated cashless giving into their fundraising
- The top three most used methods of cashless giving included online giving platforms (65%), directly through website (57.5%) and direct debit (52.5%)
| Value | Percent | Number |
|---|---|---|
| Online giving platforms | 65.0% | 26 |
| Directly through your website | 57.5% | 23 |
| Direct debit | 52.5% | 21 |
| PayPal | 50.0% | 20 |
| Social media | 37.5% | 15 |
| Contactless terminal | 22.5% | 9 |
| SMS text | 10.0% | 4 |
| Crowdfunding | 5.0% | 2 |
| Credit card | 2.5% | 1 |
| Standing order | 2.5% | 1 |
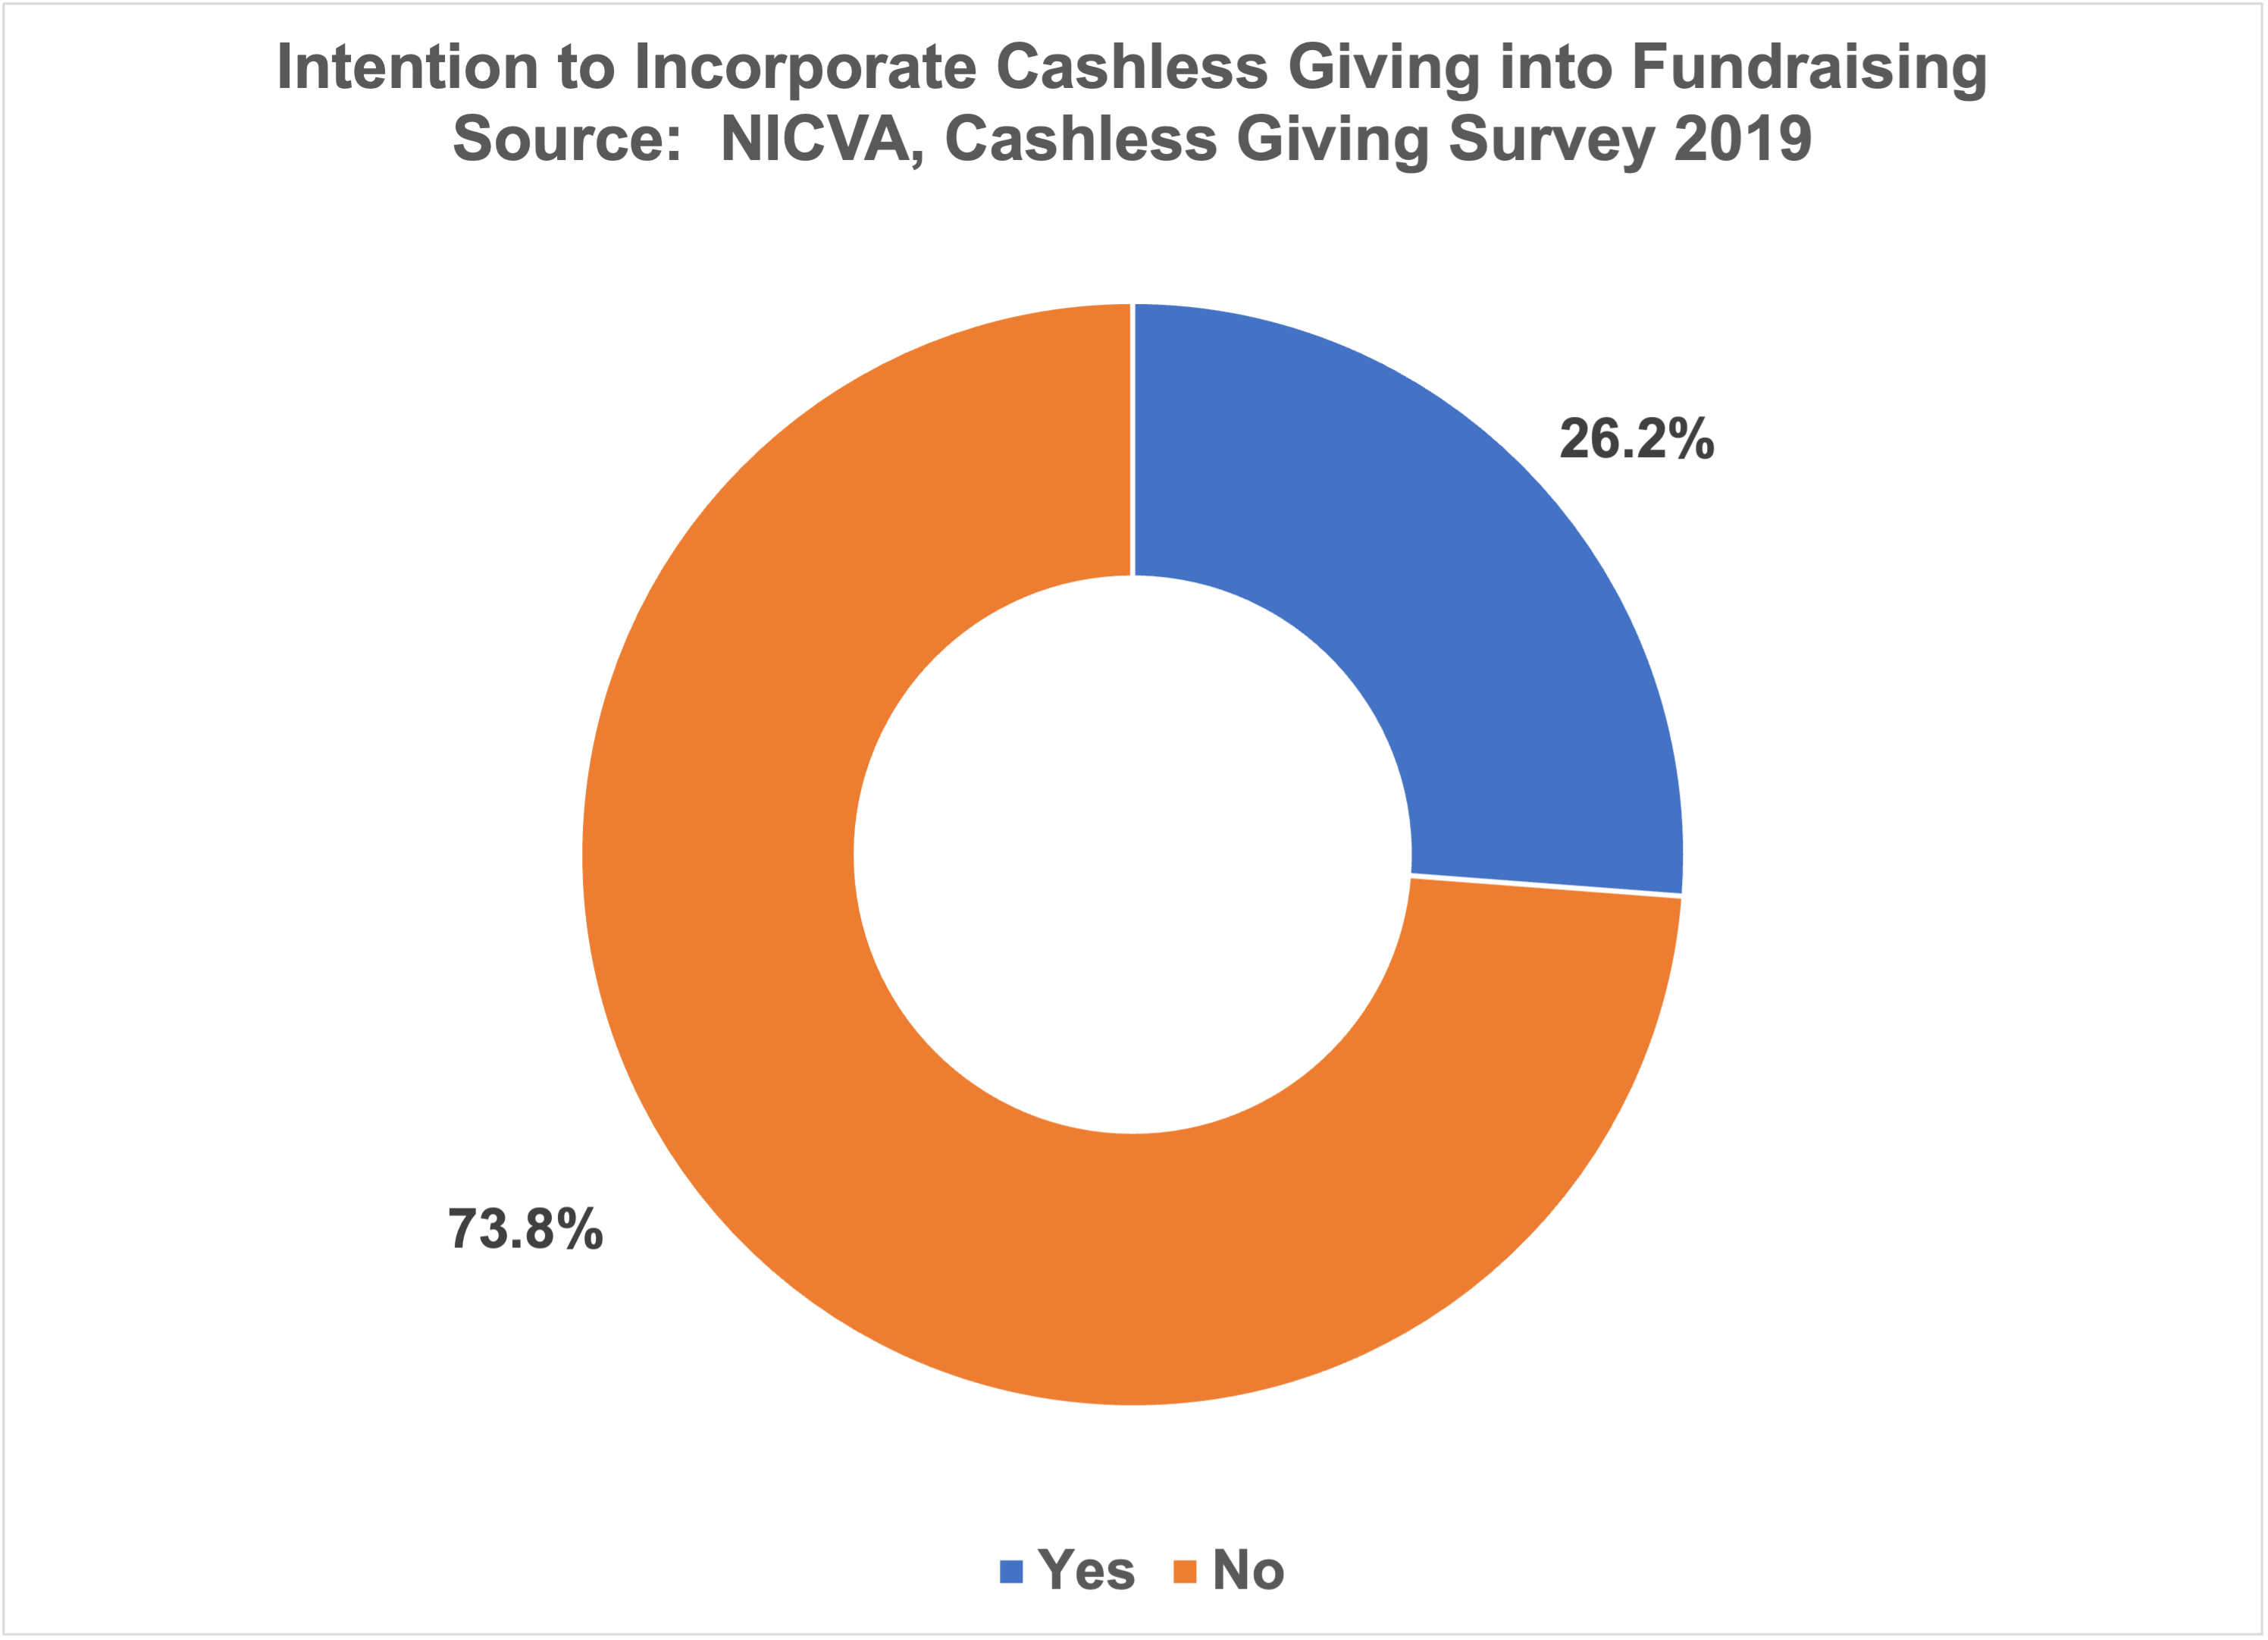
- Over one quarter (26.2%) of organisations reported that they did intend to incorporate cashless giving into their fundraising
- For those who had planned to incorporate cashless giving, plans included inserting a donate button on their website, Gift Aid, Just Giving and Easy Fundraising subscriptions and cashless collection buckets
- For those who did not have plans to incorporate cashless giving, barriers included "the lack of a fundraising team in NI", "prefer to deal with cash" "lack knowledge", "guidance and support around cashless giving", "contactless machines are too expensive" and "did not feel that it was relevant to their organisation"
- Participants provided examples of local, national, or international method of cashless giving which included SumUp, GoodBox, Text to donate, GoFundMe, Gift Aid, PayPal, and contactless collection boxes
2.0 Advice, Support and Training Needs
Organisations were asked about advice, support and/or training needs around cashless giving. They indicated that they would like information on claiming gift aid on contactless payments, information on the benefits of incorporating cashless giving and information on the use of contactless machines. Additionally, information on associated costs, provision of practical tools for making cashless giving a reality, short training courses and accessing funding for the provision of cashless machine is also needed.
UN Sustainable Development Goals (SDGs) Awareness Viewfinder 2019
In January 2019, NICVA undertook a survey to determine our member organisations’ awareness and use of the UN Sustainable Development Goals (SDGs). This survey was disseminated to NICVA member organisations (n=1,033) using online survey software between January - February 2019 and achieved a response rate of 13% (n=134). This data represents a sample of the NICVA membership and is not necessarily fully representative of all VCSE sector organisations in Northern Ireland.
1.0 Awareness and Alignment to the SDGs
- Over half (51.9%) of NICVA membership were aware of the existence of the UN Sustainable Development Goals (SDGs)
- 14.3% of organisations had intentionally set out to become aligned to the SDGs
- Whereas, 70.2% of organisations had unintentionally set out to become aligned to the SDGs (i.e. their work aligned with them without any conscious decision to do so)
- Good Health and Wellbeing (81.3%), Reduced Inequalities (53.7%) and Quality Education (51.5%) were the top three SDGs most relevant to organisations
| Frequency | Percent | |
|---|---|---|
| Good Health and Wellbeing | 109 | 81.3% |
| Reduced Inequalities | 72 | 53.7% |
| Quality Education | 69 | 51.5% |
| No Poverty | 53 | 39.5% |
| Gender Equality | 52 | 38.8% |
| Peace, Justice and Strong Institutions | 50 | 37.3% |
| Sustainable Cities and Communities | 47 | 35.0% |
| Decent Work and Economic Growth | 43 | 32.1% |
| Zero Hunger | 33 | 24.6% |
| Partnership for the Goals | 32 | 23.8% |
| Affordable and Clean Energy | 28 | 20.9% |
| Clean Water and Sanitation | 25 | 18.6% |
| Climate Action | 25 | 18.6% |
| Industry, Innovation, and Infrastructure | 24 | 17.9% |
| Responsible Consumption and Production | 21 | 15.6% |
| Life on Land | 19 | 14.1% |
| Life Below Water | 15 | 11.2% |
2.0 Importance and Adoption of the SDGs
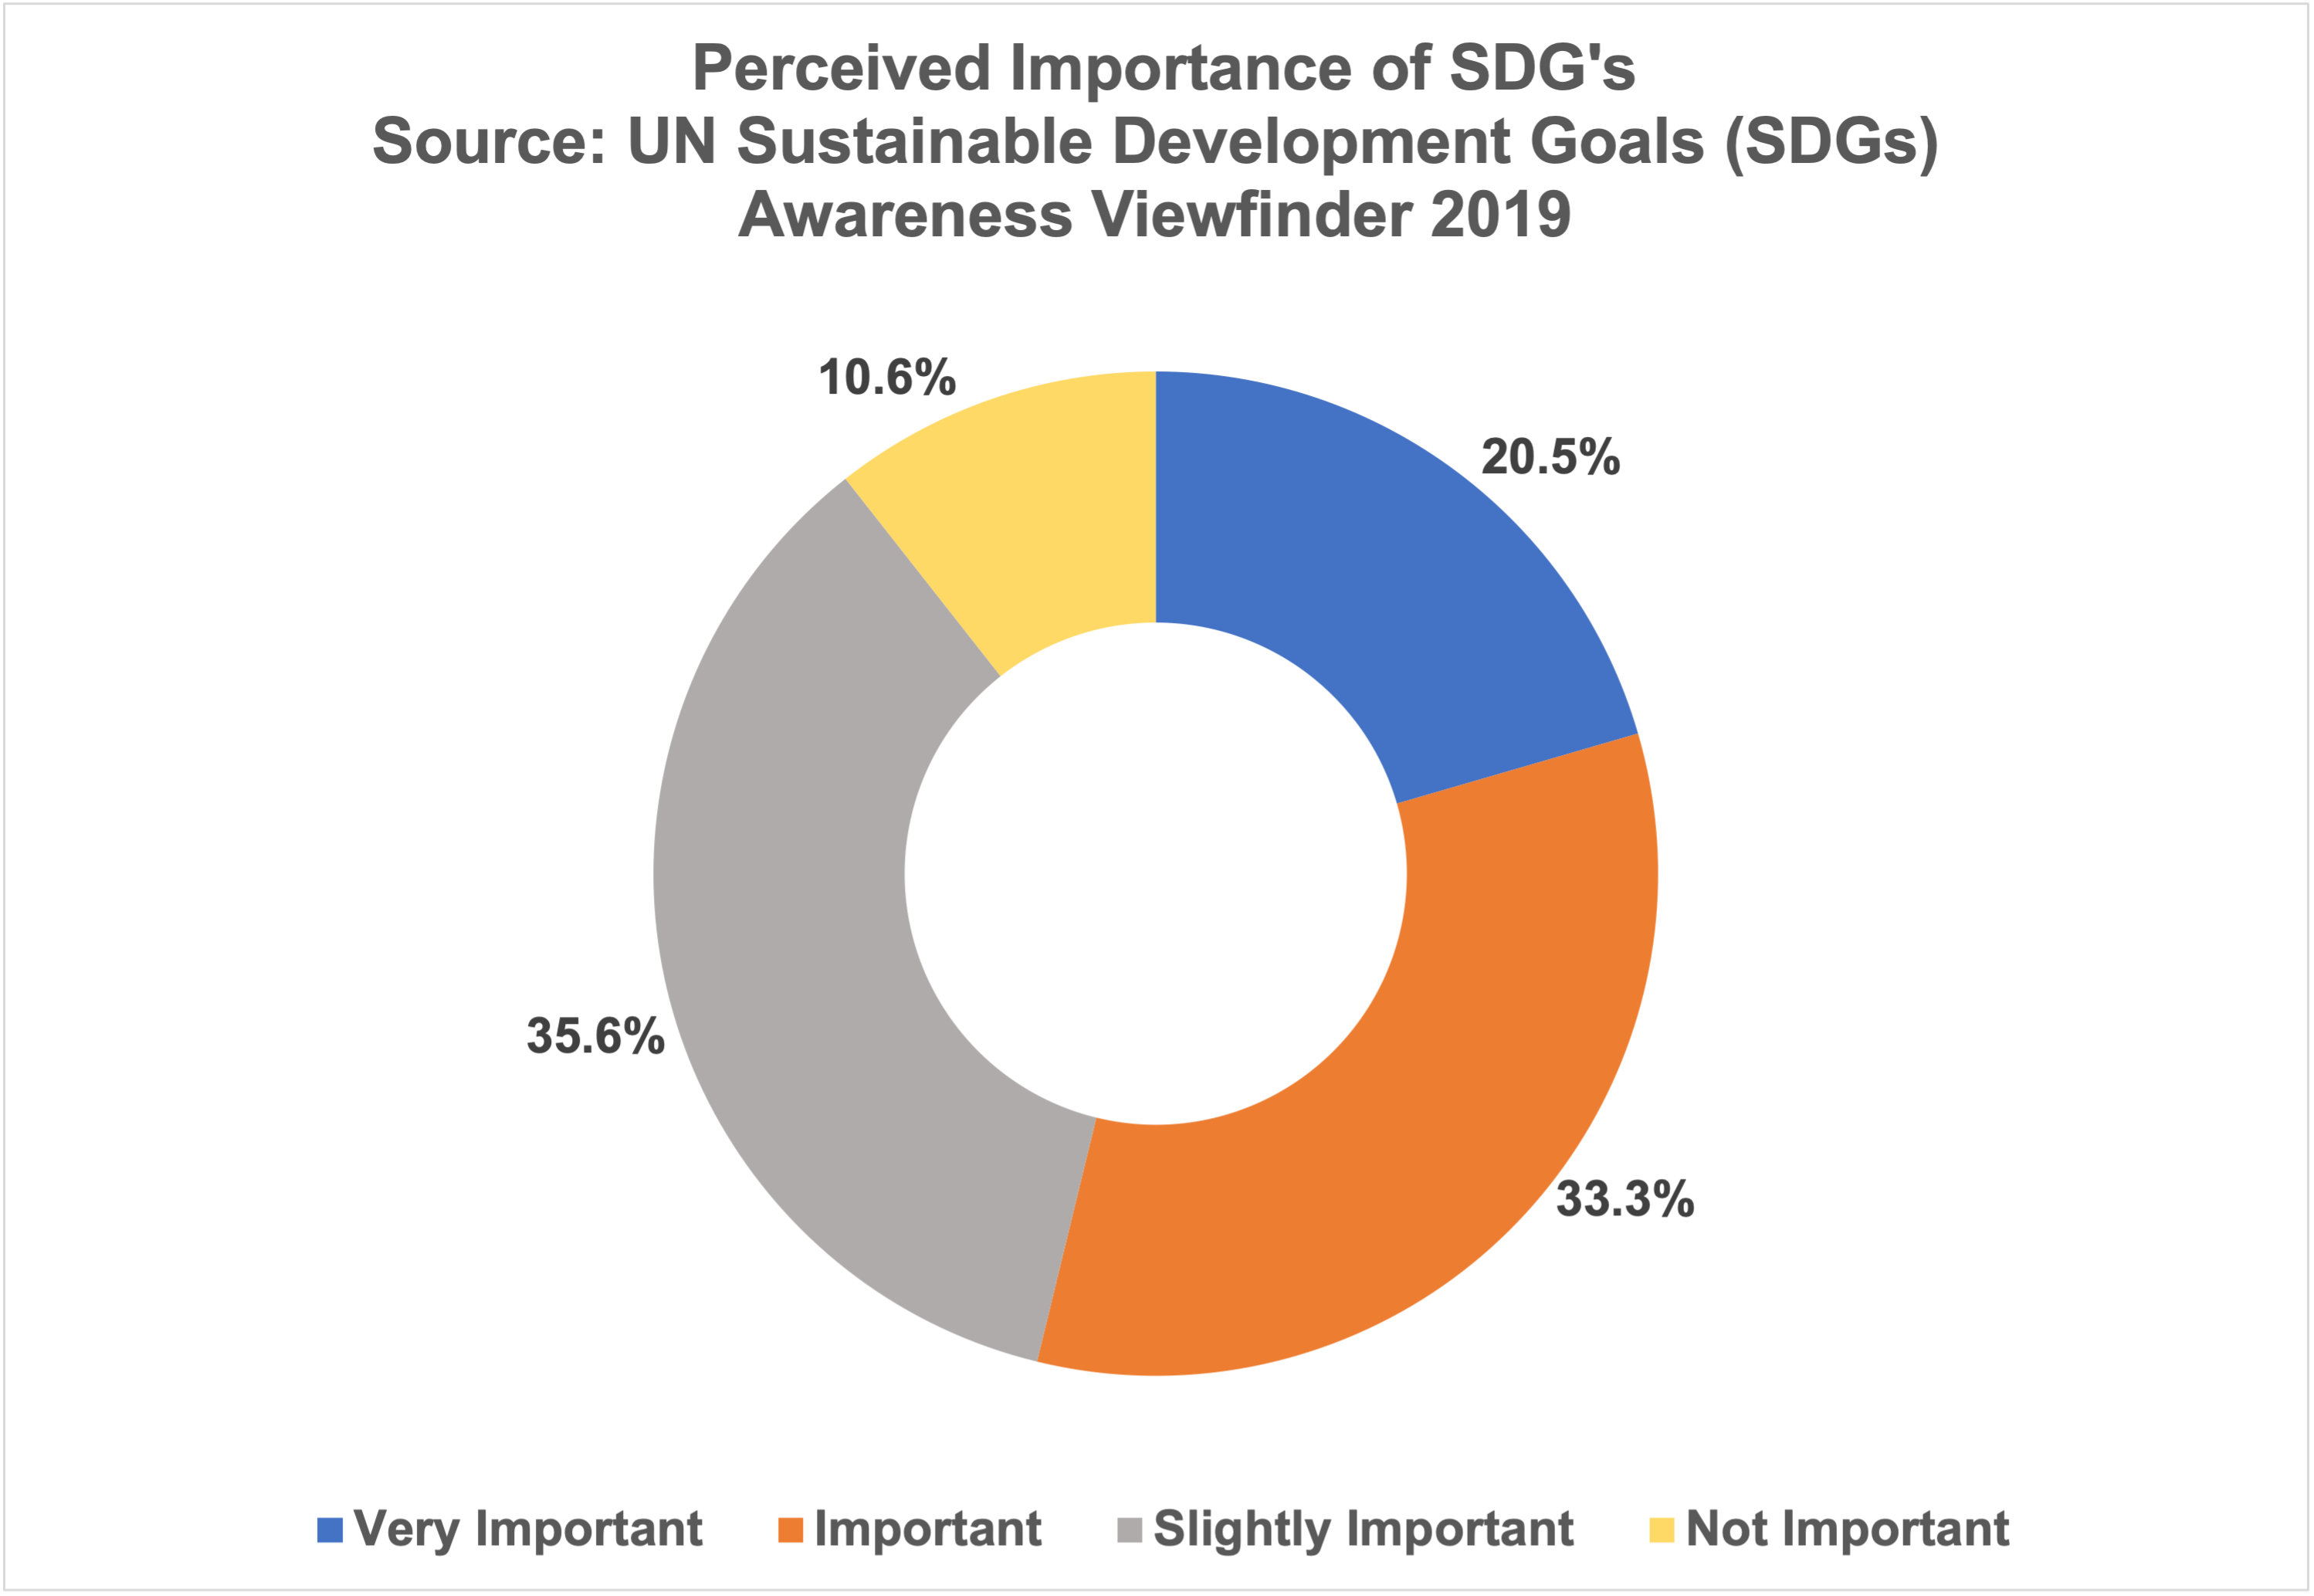
- Nearly 9 out of 10 organisations believed the SDGs to be of at least some importance to their work
- Over one fifth (20.5%) of organisations believed that the SDGs were very important to their organisation
- Good Health and Wellbeing (76.8%), Gender Equality (56.7%) and Reduced Inequalities (60.4%) were the top three SDGs that organisations believed should be adopted by all
- 40.1 % of organisations said they would consider undertaking more work to align with the SDGs
| Frequency | Percent | |
|---|---|---|
| Good Health and Wellbeing | 103 | 76.8% |
| Reduced Inequalities | 81 | 60.4% |
| Gender Equality | 76 | 56.7% |
| Quality Education | 75 | 56.0% |
| Peace, Justice and Strong Institutions | 73 | 54.5% |
| No Poverty | 69 | 51.5% |
| Decent Work and Economic Growth | 67 | 50.0% |
| Sustainable Cities and Communities | 59 | 44.0% |
| Zero Hunger | 58 | 43.3% |
| Clean Water and Sanitation | 57 | 42.5% |
| Affordable and Clean Energy | 55 | 41.0% |
| Responsible Consumption and Production | 55 | 41.0% |
| Climate Action | 55 | 41.0% |
| Partnership for the Goals | 48 | 35.8% |
| Industry, Innovation and Infrastructure | 36 | 26.8% |
| Life Below Water | 34 | 25.3% |
| Life on Land | 34 | 25.3% |